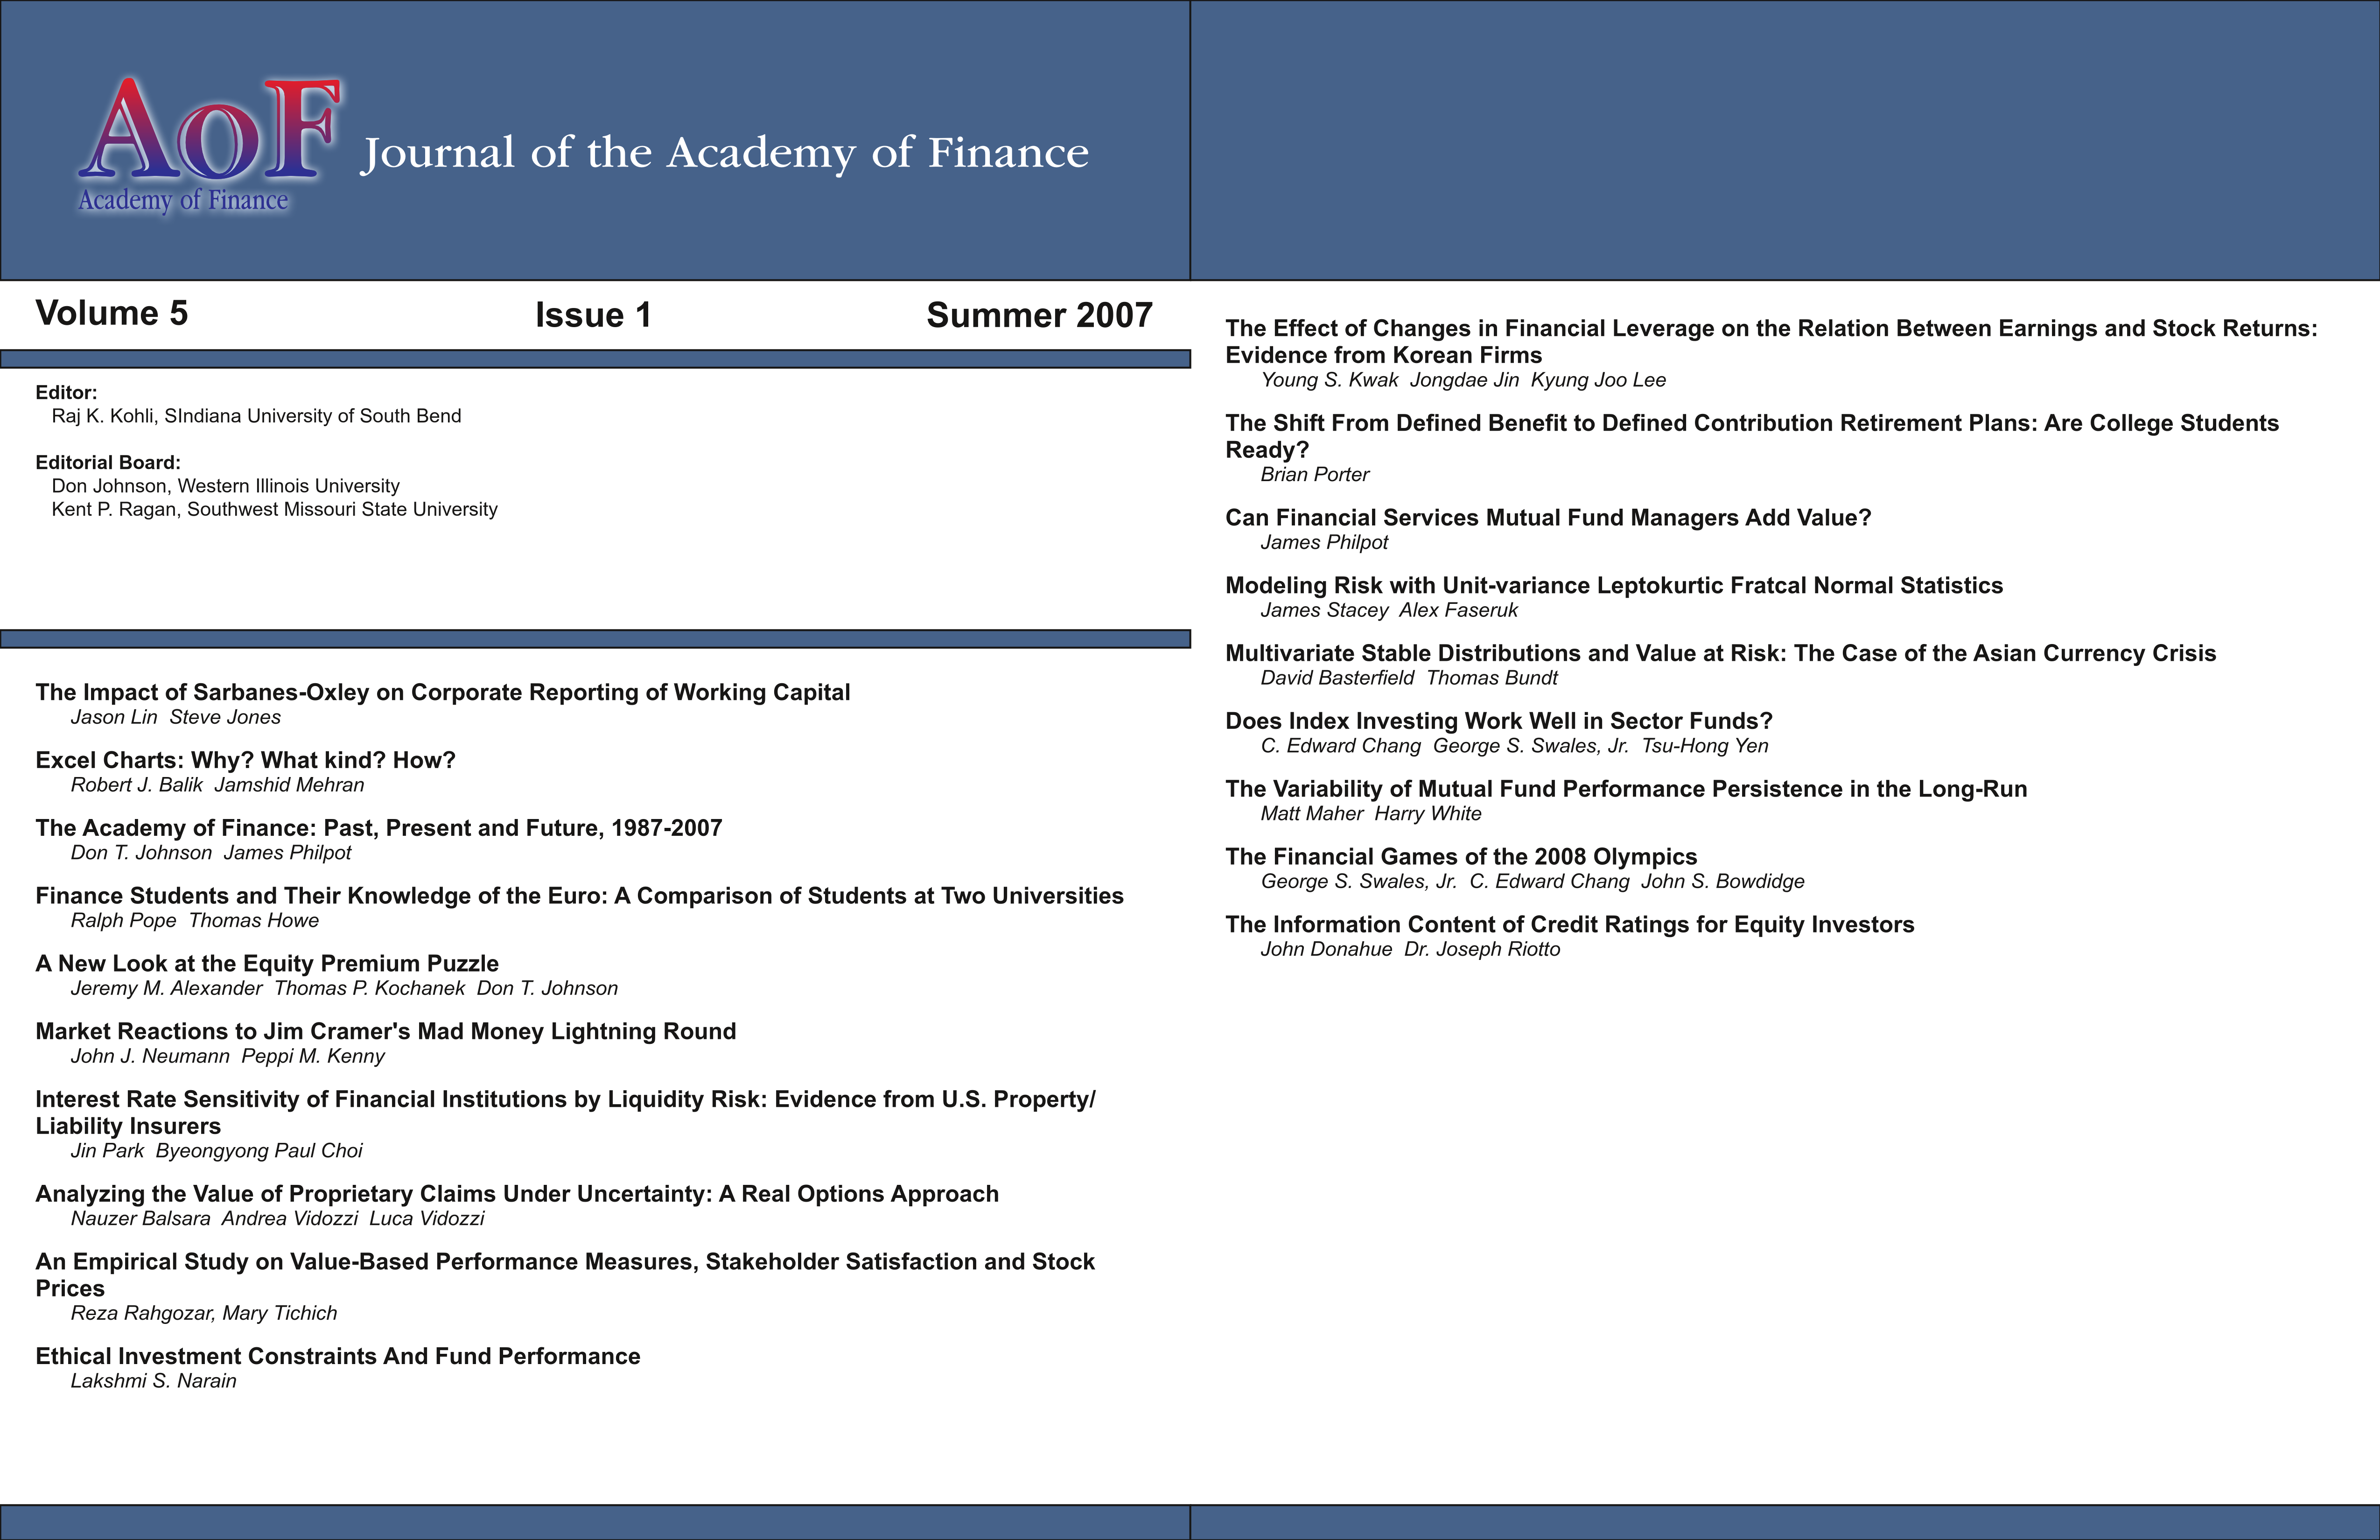
Excel Charts: Why? What kind? How?
DOI:
https://doi.org/10.58886/jfi.v5i1.2583Abstract
This abstract was created post-production by the JFI Editorial Board.
A common form of visual design used in finance is a chart or graph. Excel's chart feature is used to create virtually all charts. Most finance teachers and their students know how to use Excel to create basic charts, but many do not know how to decide when to create a chart, how to decide what kind of chart to create, and how to decide what features the chart should have. For finance teachers and students knowing how to use Excel to create charts is not enough. It is important that they also know some of the best practices to use to design charts.
Downloads
Published
2007-06-30
How to Cite
Balik, Robert, and Jamshid Mehran. 2007. “Excel Charts: Why? What Kind? How?”. Journal of Finance Issues 5 (1):12-25. https://doi.org/10.58886/jfi.v5i1.2583.
Issue
Section
Original Article


